A reminder of how data is represented for processing & storage
Keywords
How bitmap images like photographs are processed, sent & stored.
We now know that in order to represent something in binary we need to be able to convert it into numbers, usually denary numbers that humans understand.
But how can we use numbers to represent images? Brainstorm with the people around you and share what you think with your teacher.
But how can we use numbers to represent images? Brainstorm with the people around you and share what you think with your teacher.
How are images stored in binary?
Click through the presentation and read the slides.
Create your ownTASK 1
Using 1s and 0s create the 1-bit panda shown on the right. DOWNLOAD THE 1 BIT SHEET HERE TASK 2 Work out what the picture is using the 3 bit image sheet DOWNLOAD THE 3 BIT SHEET HERE |

|
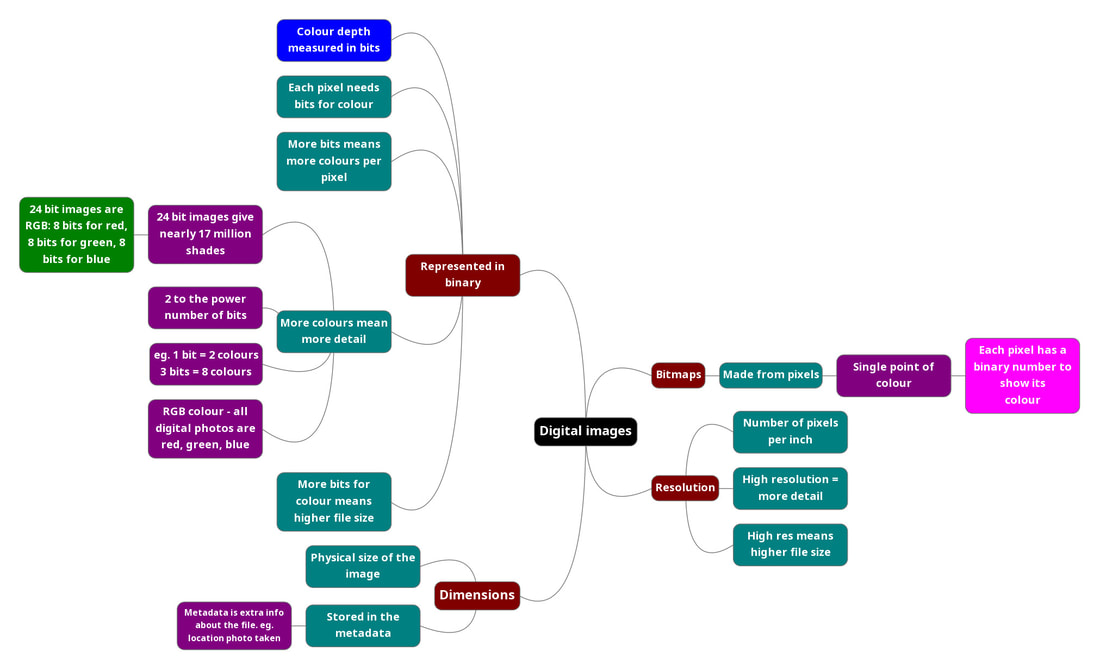
24-bit images
|
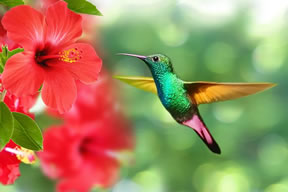
Photos are so realistic because they use 24 bits per pixel to store information about the colour of the pixel.
This allows a whopping 16,777,216 shades per pixel! On screen all pixels are made up from a mixture of red, green and blue. Using 8 bits per colour means 255 different shades of red, green and blue can be made. Because there are 16,777,216 different combinations, this many different colours can be made. TASK
|


|
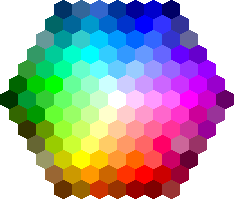
Colour MixingHave a go with this colour mixer to see how different shades are all made up from combinations of red, green and blue. Then answer the questions below:
|

|
Putting it altogether
|
Your teacher will show you how to zoom in to a photo and look at the individual colour codes of each tiny pixel. pixlr.com/editor/
Remember, that for each pixel in a photo there is a 24 bit binary number. 8 bits for the shade of red, 8 bits for the shade of blue, and 8 bits for the shade of green. This is how the image is stored and processed inside a computer. Image apps/software read these 1s and 0s and convert them into the picture that we see on screen. |
|
Watch the video about how Instagram filters work

Open Thonny from the Computer Science Apps folder on the Desktop
|
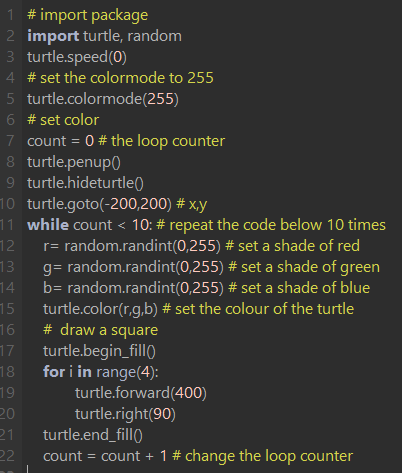
Split the screen (use Windows key and the left or right arrow) and copy out the Python code below.
Try to work out what it will do BEFORE you run it. |

|
If you have time.....try the one below as well.
Remember to predict what you think will happen before you run it.
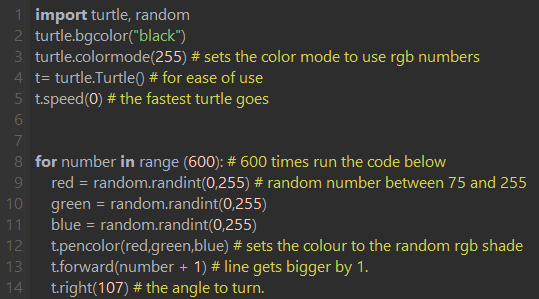
Complete the code to draw a rainbow
|
Open the file below and copy the code into a new Thonny file.
Read the code and the comments and follow the instructions to make the rainbow.
|

| ||
What does this program do?
|
Open the file below. Read it and predict what will happen when you run the program.
Write your idea in the box on the right.
Test your prediction!Open a new Thonny file (File - New).
Copy the code from the text file and paste into Thonny. Save the file. Run the file. Were you correct?? 
|
| ||

pixels, bits, colour, rgb, binary, resolution, dimensions
Academic writing - write like a Computer Scientist

Drag, drop and copy out
|
|

|
Know your keywords!
Check point 4
Spelling test
|
Reading for meaning
How well do you really understand what you have learned? Take your time. Be silent. Concentrate. Your teacher will give you a printed sheet with the reading task on it. You should read it carefully and slowly. Underline or highlight key terms and concepts. Once you have read the text once, begin to answer the questions. Your teacher will tell you how she prefers you to submit your answers. |
|
Planning an extended piece of writing
Click the target to view it larger

|

|
Binary - extended academic writing task
Use the target plan to help you.
