Metals and other natural resources are used in technology
Have a look through the slideshow below. There are questions in the form below it. The answers to the form are in the slide show.
This is an exercise in EXTRACTING INFORMATION from what you read.
This is an exercise in EXTRACTING INFORMATION from what you read.
Use the information in the slide show above to answer the questions below. For question 2, write in FULL SENTENCES and give detail.
Where in the world? Reading For Meaning
|
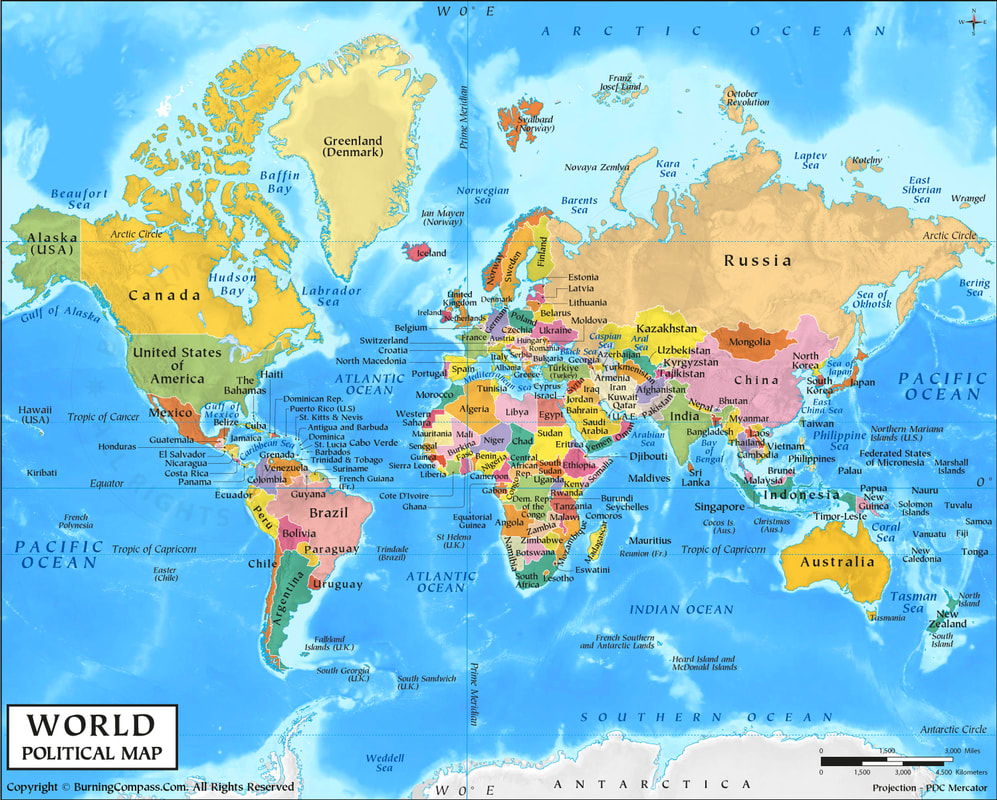
You will need a Powerpoint and the map below.
Copy the map into the Powerpoint. Read the text below (or download the file to read as a PDF) and then label the map with country and the material/s that come from that country. Can you find ALL the different countries mentioned in the text?? HINT: there are about 20. Add a list of the countries underneath your map.
Poster or presentatation?It depends on the use for the product you are making.
You will create both a poster AND a presentation from the same information. Your teacher will show you how to duplicate the slides. If we want the work to be interactive so the user can click on parts of the map to find out what elements come from there, then we need to use the offline Powerpoint. |
| ||
Amazon Cloud Computing - Keeping Data Secure and Sustainable

Manufacturing and shipping
Electronic Waste (E-waste)
|
|
|
|
Create a poster with Python in Thonny
|
You can download the code for the poster BUT it is in a text file and it is NOT in the right order.
The text file contains blocks of code labelled Block A through to Block J. Your task is to read the code and logically work out how to paste them into Thonny in the correct order. If you are correct, you will create the poster below. Here is the code

|
You can download the code for the poster BUT it is in a text file and it is NOT in the right order.
The text file contains blocks of code labelled Block A through to Block K. Your task is to read the code and logically work out how to paste them into Thonny in the correct order. If you are correct, you will create the poster below. Here is the code

| ||||
Draw an emoji
|
Using your Python turtle knowledge, draw an emoji!
Add your own text and other touches..... Here is some useful code that you haven't used before. To draw a half circle (for the mouth)t.pensize(5) # the number in the brackets is the size of the pen.
t is the name of the turtle if you have used t=turtle.Turtle() t.circle(100,180) # where t is the name of the turtle. The first number 100 is the radius...the size of the circle. The second number, 180, is how much of the circle to draw. As long as the turtle is facing in the correct direction, you will get the half circle you want. |

|
Revise with Blooket - click the image below to get started

Sources:yougov.co.uk/topics/technology/articles-reports/2020/05/07/45-smartphone-owners-would-rather-upgrade-repair
https://sometimes-interesting.com/electronic-waste-dump-of-the-world/
https://sometimes-interesting.com/electronic-waste-dump-of-the-world/
Displaying data
|
Statistics are often shown in the form are graphs and charts. These are an easy visual method to help people quickly understand the data.
There are different styles of charts which are used depending on what type of data is being shown. These include:
|

|
|
Sources, data and charting
Your teacher will show you how to:
- Make a bar chart in Excel to show e-waste statistics by country in 2019
- Make a line chart in Excel to show the amount of e-waste collected in the UK between 2013 and 2022
- Make a pie chart in Excel to show the market share of mobile phone sales in the UK between June 2022 and June 2023.
- Run interactive versions of these charts using Python.
Bar chart
Line graph
Pie chart
Questioning your sources |
This is what Wikipedia says about the reliability of Wikipedia! |
|
The Internet is FULL of information!
A quick search brings up potentially millions of hits and most of only pick a source in the top 3. If we use ChatGTP, Google Gemini or Co-Pilot most of us will not question if the answer is right or not. But we should! ChatGTP4 - cut off date April 2023 so not the most up to date information. Nor is it always as intelligent as it seems. See below! |
|
Presentation task
Your task is to create a presentation about e-waste and recycling of e-waste.
DO NOT COPY AND PASTE TEXT!
Start with:
DO NOT COPY AND PASTE TEXT!
Start with:
- A description of e-waste, with examples.
- The charts you created previously.
- An explanation of what each chart shows. Add some analysis/conclusions about each graph. What does the graph show? What info do you learn from it? Is there anything surprising?
- Pick a country from the list of countries on the recycling e-waste spreadsheet.
- Add some slides about the country. You need to also include the sources you use and the date the page was last updated. You MAY use AI like Copilot but you MUST reference your sources and you still can't copy and paste text!
- You should include the following:
- its flag
- its capital city
- where in the world it is
- who the prime minister or president is
- what the population is. Also find the population of the UK so you have something to compare it to
- what the main industries are
- how the country deals with e-waste.
- how it is doing compared with other countries in terms of recycling e-waste - use your charts - compare the amount recycled to the amount generated
It's not all bad news
|
Technology can also help the environment:
|
|
Check point